Cement Industry Trends 2026: Market Outlook, Decarbonization & What It Means for You
The cement industry trends 2026 are defined by three structural shifts: China’s demand contraction masking 4.3% growth elsewhere, decarbonization crossing from pilot projects to commercial products (led by Brevik CCS and a $3.29B green cement market), and digital transformation splitting plants into three performance tiers with a 23+ percentage point OEE gap.
The cement industry is shrinking — except it isn’t. Global demand dipped 0.3% in 2026, yet every region outside China grew 4.3%. That single number exposes the biggest illusion in the cement market today: looking at global aggregates hides the most dramatic regional divergence in a generation. The cement industry trends 2026 reveal not a sector in decline, but one being violently rearranged along three fault lines — China’s structural slowdown, decarbonization’s leap from pilot to profit, and a digital divide separating tomorrow’s winners from today’s incumbents.
Cement produces 7–8% of global CO₂ emissions — more than aviation and shipping combined (IEA). You’ve read the net-zero pledges. What you may not realize is how fast the economics have shifted beneath those pledges. In June 2025, Heidelberg Materials fired up the world’s first industrial-scale carbon capture plant at a cement factory — and began selling the captured-CO₂ cement under a premium brand. That’s not a research milestone; that’s a commercial product shipping to customers. Three structural shifts explain what’s actually happening — and what it means for your strategy whether you produce, invest in, or buy cement.
Key Takeaways
- Global cement demand fell 0.3% in 2026, but demand outside China rose 4.3% — the most extreme regional divergence in decades (S&P Global).
- The green cement market hit $3.29 billion in 2026, growing at 11.9% CAGR — nearly four times the overall market growth rate.
- Heidelberg Materials’ Brevik CCS plant became the world’s first industrial-scale carbon capture facility at a cement works, with evoZero® cement now shipping across Europe.
- Digitally mature cement plants achieve 85–91% OEE versus 62–68% at reactive plants — a performance gap that translates to millions in annual margin difference.
- CRH’s $2.1 billion acquisition of Eco Material Technologies signals that capital is chasing decarbonization supply chains, not new kiln capacity.
Cement Industry Trends 2026: Global Market Snapshot
Market Size and Growth Projections
The headline numbers demand attention — and caution. When analyzing cement industry trends 2026, anyone following the cement market size 2026 debate has encountered a wide range: the global cement market sits at an estimated 384–426billionin2025∗∗,projectedtoreach∗∗384–426billionin2025∗∗,projectedtoreach∗∗411–436 billion in 2026 depending on the source and methodology (Fortune Business Insights; Mordor Intelligence). That works out to a CAGR somewhere between 2.98% and 5.40%.
On the production side, global cement output reached approximately 4.37 billion tonnes in 2025, with projections pointing toward 5.51 billion tonnes by 2031 (Mordor Intelligence). Volume-wise, that’s steady growth — but it masks enormous variation beneath the surface.
The problem with these global aggregates is simple: they lump together a Chinese market in structural decline with an ex-China world experiencing robust growth. Making strategic decisions based on global averages in 2026 is like planning your wardrobe based on the world’s average temperature. It tells you nothing useful about where you’re actually standing.
The China Divergence: Why Global Numbers Mislead
Here is the single most important data point for understanding the cement market outlook 2026: according to S&P Global analyst Touahri, global cement demand fell 0.3% in 2026 — but demand excluding China rose 4.3% year over year.
China’s cement output dropped roughly 10% in 2024, and the contraction hasn’t stopped. The property sector deleveraging that began with Evergrande’s collapse has evolved into a permanent restructuring. China is building less — and that structural shift isn’t cyclical. Urbanization rates are plateauing, the population is declining, and the era of double-digit infrastructure spending is largely over.
A cement producer with heavy China exposure is fighting for share in a shrinking market. If you’re anywhere else, you’re operating in a market growing well above the global average — and your competition includes players who may be distracted by their own China-related write-downs.
Key Market Drivers and Headwinds
Several forces are pulling the market in opposite directions:
- Infrastructure spending in the US ($550 billion Bipartisan Infrastructure Law), Saudi Arabia (Vision 2030), and India (national highways and housing programs) is creating genuine demand.
- Urbanization continues in Africa, South Asia, and Southeast Asia — regions where per-capita cement consumption is still a fraction of China’s peak.
- Overcapacity remains a drag, particularly in China and parts of Europe, keeping utilization rates well below optimal.
- Carbon costs are rising faster than many producers anticipated, with EU ETS free allowance phase-outs beginning and CBAM imposing border charges on carbon-intensive imports.
Where you operate matters more than how big you are. That’s the net effect of forces pulling in opposite directions.
Regional Deep Dive: Where the Growth Is
Understanding cement industry trends 2026 requires looking past global averages to regional realities.
Asia-Pacific — Still the Giant, But Shifting
The Asia-Pacific region accounts for 74.6% of global cement consumption (Mordor Intelligence). That dominance isn’t changing — but its composition is.
China remains the world’s largest cement market by far, but its share is declining in absolute terms. India, by contrast, is the growth engine. The Indian government’s infrastructure push — including the Bharatmala highway program and Pradhan Mantri Awas Yojana housing initiative — is driving double-digit demand growth in several states.
Southeast Asia tells a similar story: Vietnam, Indonesia, and the Philippines are all adding capacity to serve growing domestic construction markets. But capacity additions are outstripping demand growth in some markets, creating margin pressure even as volumes rise.
For anyone tracking the cement demand forecast by region 2026, the Asia-Pacific story is really two stories: China’s managed decline and India-plus-Southeast-Asia’s infrastructure-fueled expansion.
Middle East & Africa — The Fastest-Growing Frontier
The Middle East and Africa region is growing at a 4.92% CAGR — the fastest of any global region. The driver is no secret: Saudi Arabia’s Vision 2030.
Saudi Arabia’s construction market was valued at approximately 105billionin2024∗∗,withprojectionsreaching∗∗105billionin2024∗∗,withprojectionsreaching∗∗174 billion by 2030 at an 8.7% CAGR (ResearchAndMarkets). Mega-projects like NEOM, The Red Sea Project, and Diriyah Gate are consuming cement at extraordinary rates. The kingdom’s green building sector alone is projected to reach $33 billion by 2030, creating parallel demand for low-carbon cement products.
Africa’s growth story is more distributed but no less real. Urbanization rates across sub-Saharan Africa are among the highest in the world, and per-capita cement consumption remains extremely low — meaning even modest income growth translates to significant demand increases. Heidelberg Materials didn’t build the world’s largest calcined clay plant in Ghana out of goodwill. They built it because the economics work — African demand growth and clinker substitution savings align.
Key Takeaway: If your growth strategy doesn’t include the Middle East or Africa, you’re leaving the fastest-growing cement markets on the table. But success requires navigating regulatory complexity and logistics challenges that differ sharply from mature markets.
North America — Infrastructure Boom Meets Decarbonization
The US Bipartisan Infrastructure Law’s $550 billion in new spending is the largest infrastructure investment in a generation. The Portland Cement Association (PCA) estimates it will generate an additional 46 million tonnes of cement demand over five years.
But North America’s story isn’t just about volume. It’s about the collision between demand growth and decarbonization mandates. The Inflation Reduction Act directed $127 million in Department of Energy funding toward carbon capture projects in the cement sector. State-level Buy Clean laws — in California, New York, Colorado, and others — are creating procurement preferences for low-carbon cement.
For producers, this creates a dual imperative: ramp up output to serve infrastructure demand while simultaneously decarbonizing that output. For procurement managers, it means low-carbon options are becoming available — but at a premium that requires justification within existing budgets.
Europe — The Decarbonization Laboratory
Europe is where the cement industry’s decarbonization future is being built — and where the cost of that future is being priced in real time.
The EU Emissions Trading System (EU ETS) is the most consequential policy mechanism. Free allowances for cement producers are being phased out starting in 2027, with annual reductions of 4.3 percentage points, converging toward full auctioning by 2034. At the same time, the Carbon Border Adjustment Mechanism (CBAM) is imposing carbon costs on imported cement and clinker, leveling the playing field for European producers who face higher compliance costs.
S&P Global estimates that CBAM will lift European cement prices by approximately 5% — enough to change the economics of clinker substitution, alternative fuels investment, and CCS deployment.
Europe is becoming a testbed for every decarbonization technology in the cement playbook — and producers who figure out how to thrive under these conditions will export their know-how globally as carbon pricing spreads.
Trend 1: Decarbonization Moves from Promise to Commercial Reality
Pledges, roadmaps, pilot projects — the cement industry’s decarbonization folder was thick on promises and thin on shipped product. That folder is getting thinner. Among the most significant cement industry trends 2026, decarbonization’s shift to commercial viability stands out. The cement industry decarbonization trends 2026 are defined not by what companies are promising, but by what they’re shipping.
CCUS Breakthrough: Brevik CCS and Beyond
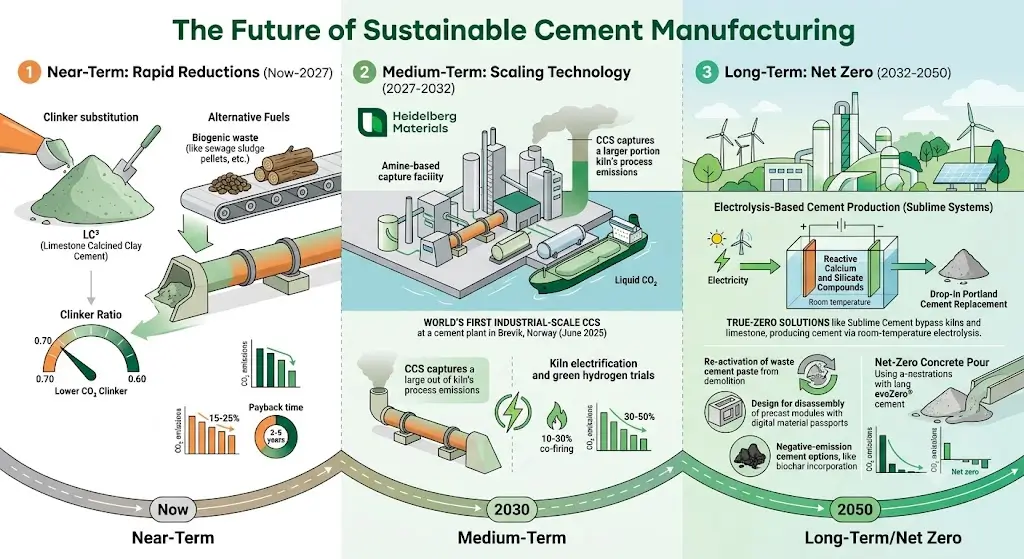
On June 18, 2025, Heidelberg Materials officially inaugurated the Brevik CCS facility in Norway — the world’s first industrial-scale carbon capture and storage plant at a cement works. The facility captures approximately 400,000 tonnes of CO₂ annually, which is then stored permanently beneath the North Sea.
But the real story isn’t the technology. It’s the product. Heidelberg Materials launched evoZero®, the world’s first near-zero carbon captured cement, and began delivering it to customers across Europe in October 2025. This isn’t a limited-run showcase. It’s a commercial brand with verified CO₂ savings, priced at a premium, and targeted at projects where embodied carbon matters — green building certifications, ESG-mandated construction, and public infrastructure with Buy Clean requirements.
The Brevik project proved something the industry had long debated: that carbon capture at a cement plant can work at industrial scale, and that the resulting product can find a market willing to pay for its low-carbon attributes. That changes the calculus for every cement CEO weighing CCS investment.
Meanwhile, the US Department of Energy allocated $127 million in funding for carbon capture demonstration projects at cement plants, and several European producers have announced CCS projects of their own, feeding into shared Northern Lights transport and storage infrastructure in the North Sea.
Want to understand how carbon capture economics play out in practice? Download our full cement decarbonization report →
Clinker Substitution: The Quiet Revolution
CCS grabs headlines. Clinker substitution saves margins. The clinker-to-cement ratio has dropped from approximately 85% in 2000 to roughly 75% today — and the pace of decline is accelerating.
The mechanism is straightforward: replace energy-intensive clinker with supplementary cementitious materials (SCMs — the low-carbon ingredients that replace energy-intensive clinker) like ground granulated blast furnace slag, fly ash, calcined clay, or natural pozzolans. Each percentage point of clinker reduction cuts both CO₂ emissions and fuel costs.
In May 2025, Heidelberg Materials and CBI Ghana commissioned the world’s largest calcined clay plant in Tema, Ghana, with an annual capacity exceeding 400,000 tonnes. The plant replaces imported clinker with locally produced calcined clay, cutting carbon emissions by up to 40% per tonne of cement. For a region that imports much of its clinker, the economics are compelling even before you factor in carbon pricing.
The catch? Traditional SCM sources are declining. Fly ash and slag supplies are shrinking as coal plants close and electric arc furnaces replace blast furnaces. That’s why investments in new SCM sources — calcined clay, volcanic ash, and even recycled concrete fines — are accelerating. CRH’s $2.1 billion acquisition of Eco Material Technologies, completed in September 2025, was essentially a bet that the supply of alternative cementitious materials will be worth more than the cement they displace.
Alternative Fuels: From Coal to Waste
The shift from fossil fuels to alternative sources is progressing, though more slowly than many net-zero roadmaps assume. Alternative fuel substitution rates have risen from roughly 5% in 2010 to approximately 12% globally — with wide variation by region (IEA, Worldmetrics).
European plants lead, with some achieving substitution rates above 70%. Holcim invested CHF 250 million ($278 million) to upgrade its Swiss plant to achieve alternative fuel rates exceeding 85%. In many developing markets, however, rates remain in single digits, constrained by waste collection infrastructure and regulatory frameworks.
The fuel transition matters because it addresses roughly 40% of cement’s direct CO₂ emissions. Combined with clinker substitution (which addresses the other 60% from process emissions), the two levers together can deliver meaningful emission reductions without CCS — buying time for carbon capture economics to mature.
Green Cement Market: The Numbers
The green cement market reached an estimated 2.94billionin2025andisprojectedtohit2.94billionin2025andisprojectedtohit3.29 billion in 2026, growing at a CAGR of 11.9% (Research and Markets). That’s nearly four times the growth rate of the overall cement market — and the green cement market growth 2026 trajectory shows no signs of slowing.
“Green cement” is a broad category encompassing low-clinker cements, geopolymer cements, carbon-captured cements like evoZero®, and cements using high proportions of alternative fuels. What unites them is a value proposition that goes beyond compressive strength: they help builders meet embodied carbon targets, satisfy green procurement mandates, and earn certifications like LEED and BREEAM.
The 11.9% CAGR signals something important: decarbonization has sprouted its own market logic — demand, pricing power, brand differentiation. Producers who treat low-carbon cement as a cost center are missing the revenue opportunity. Those who treat it as a differentiated product — with the pricing power and customer relationships to match — are building the next competitive advantage.
Key Takeaway: Decarbonization has crossed the commercial threshold. CCS is shipping product, clinker substitution is accelerating, and the green cement market is growing at nearly 4x the rate of conventional cement. Decarbonize now or pay the latecomer’s premium. There’s no third option.
Trend 2: Digital Transformation Splits the Industry
If decarbonization is the industry’s most visible transformation, digital maturity is its most consequential divide. The cement industry future trends point to a sector bifurcating between plants that run on data and plants that run on experience — and the performance gap between them is staggering. Digital transformation is another of the cement industry trends 2026 reshaping competitive dynamics at the plant level.
AI-Powered Operations: From Pilot to Production
Artificial intelligence in cement production has moved well beyond predictive maintenance dashboards. In 2026, leading plants are deploying AI for real-time kiln optimization, automated quality control, and autonomous grinding circuit management.
Consider what this looks like in practice: an AI system monitors hundreds of process variables — raw material composition, kiln temperatures, cooler performance, and fuel energy content — and adjusts setpoints every 30 seconds. No operator can process that many variables at that frequency. The payoff: fuel savings of 5–8%, reduced clinker variability, and fewer quality excursions that would otherwise require downgrading product or reprocessing.
The technology is proven. What’s changing in 2026 is the scale of deployment. Early adopters are moving from single-process optimization (kiln, mill, or cooler) to integrated plant-wide control — connecting raw material management, production scheduling, energy procurement, and logistics into a single optimization loop.
The Digital Maturity Gap: Three Tiers of Performance
The most striking data in the cement industry trends 2026 landscape isn’t about what the best plants achieve — it’s about the distance between the best and the rest. Industry analyses identify three distinct tiers of digital maturity:
| Metric | Reactive Plants | Connected Plants | Intelligent Plants |
|---|---|---|---|
| OEE (Overall Equipment Effectiveness) | 62–68% | 74–80% | 85–91% |
| CO₂ Intensity | 0.65–0.72 t/t | 0.58–0.65 t/t | 0.48–0.58 t/t |
| Unplanned Downtime | 180–220 hrs/yr | 90–130 hrs/yr | 40–70 hrs/yr |
Let’s put those numbers in context. An intelligent plant running at 88% OEE versus a reactive plant at 65% — that’s a 23-point gap. But it’s not just a percentage game. That gap translates to roughly 35% more salable output from the same asset base, lower energy per tonne, and less than a third of the unplanned downtime.
For a 2-million-tonne-per-year plant, the margin difference between reactive and intelligent performance can exceed $20 million annually. That’s not a rounding error. It’s the difference between investing in decarbonization and deferring it.
The digital maturity gap also explains why some producers can afford CCS and alternative fuel investments while others cannot. Digital transformation is enabling decarbonization — not replacing it, but making it economically feasible by freeing up the capital and operational slack required.
Ready to see where your operations fall on the digital maturity spectrum? Subscribe to our industry insights for benchmarking tools →
Digital Twins, IoT, and the Smart Cement Plant
The concept of the digital twin — a virtual replica of the physical plant that updates in real time — has been discussed for years. In 2026, it’s operational.
Leading producers have deployed digital twins that integrate IoT sensor data, process models, and historical performance to simulate operating scenarios before implementing them in the real plant. Want to test whether switching to a new alternative fuel mix will maintain clinker quality? Run the simulation. Considering a different kiln feed recipe to lower the clinker factor? Model it first.
IoT infrastructure — from kiln shell scanners to online analyzers to vibration monitoring on critical rotating equipment — provides the data foundation. Cloud and edge computing handle the speed. The algorithms turn all that data into decisions.
The smart cement plant isn’t a future concept. It’s a present-day competitive advantage that’s compounding — because every additional year of operational data makes the models better, widening the gap between digital leaders and laggards.
Key Takeaway: Digital maturity determines which performance tier you compete in — and whether you can afford decarbonization at all. The 23+ percentage point OEE gap between reactive and intelligent plants represents millions in annual margin. In 2026, digital transformation isn’t optional; it’s the prerequisite for competing on decarbonization economics.
Trend 3: M&A, Consolidation, and Capital Reallocation
The deal flow in cement tells you where the industry is heading. In 2026, capital is flowing toward decarbonization capabilities and regional consolidation — not toward building new kilns. The M&A landscape reflects broader cement industry trends 2026: capital following carbon, not capacity.
Big Players, Bigger Moves
Holcim completed the spin-off of its North American business as Amrize in June 2025, achieving a valuation exceeding $30 billion on the NYSE. The spin-off was the largest in the building materials sector’s history, and it signaled a broader strategy: focus capital on markets where Holcim has scale advantages, and deploy that capital toward decarbonization, not geographic sprawl.
Holcim followed the Amrize separation with an aggressive acquisition plan — targeting approximately 15 acquisitions in 2026, primarily in aggregates, ready-mix, and sustainable building solutions. The $278 million investment to upgrade its Swiss plant to 85%+ alternative fuel substitution exemplifies the strategy: invest in assets that lower the carbon intensity of existing capacity.
CRH made its own statement with the $2.1 billion acquisition of Eco Material Technologies, completed in September 2025. Eco Material Technologies is North America’s leading supplier of supplementary cementitious materials — the very inputs needed for clinker substitution. This wasn’t a bet on selling more cement. It was a bet on selling less clinker per unit of cement, and controlling the supply chain that makes that possible.
Capital Flows: Funding Decarbonization, Not Expansion
The pattern is clear: the most significant capital deployments in 2025–2026 aren’t going toward new greenfield kiln capacity. They’re going toward:
- Carbon capture infrastructure (Heidelberg Materials’ Brevik, followed by multiple European CCS project announcements)
- SCM supply chains (CRH’s Eco Material Technologies deal)
- Alternative fuel systems (Holcim’s Swiss plant upgrade, similar investments across Europe)
- Digital infrastructure (plant automation, AI platforms, IoT sensor networks)
The old playbook — build capacity where demand is growing — is being shelved. The new one: decarbonize capacity where carbon costs are rising. The difference matters because it rewards a different set of capabilities — process engineering, fuel substitution expertise, and digital optimization — over raw scale.
Dalmia Cement Acquires Jaiprakash Associates
India’s cement consolidation story deserves its own mention. In May 2026, Dalmia Bharat announced the acquisition of Jaiprakash Associates’ cement assets for ₹2,850 crore (approximately $340 million), adding 5.2 million tonnes of capacity in Madhya Pradesh and Uttar Pradesh. The deal raised Dalmia Bharat’s total capacity to 54.7 MTPA.
This acquisition is emblematic of India’s cement M&A wave: mid-tier producers are being absorbed by larger players seeking regional density and scale economics. The Competition Commission of India approved the deal in August 2025, and the assets were acquired from the Adani Group, which had itself purchased Jaiprakash Associates through insolvency proceedings.
For India — the world’s second-largest cement market and the fastest-growing major demand center — consolidation is being driven by the need to achieve the scale required for both cost efficiency and decarbonization investment.
Key Takeaway: Capital is following carbon, not capacity. The biggest deals of 2025–2026 — Holcim’s Amrize spin-off, CRH’s $2.1B SCM acquisition, Heidelberg Materials’ CCS investment — all point to the same conclusion: the industry is reallocating capital from building more kilns to making existing kilns cleaner and smarter.
Cement Industry Trends 2026: Policy & Regulatory Forces
Policy isn’t just background context for the cement industry trends 2026 — it’s the primary driver of competitive advantage. Three regulatory forces are reshaping the industry simultaneously.
Carbon Pricing Goes Global
The EU ETS remains the world’s most consequential carbon pricing system for cement. With free allowance phase-outs beginning in 2027 (reducing by 4.3 percentage points annually toward full auctioning by 2034), European cement producers face a steeply rising carbon cost curve.
CBAM adds a second layer: imported cement and clinker now carry a carbon border charge equivalent to what EU producers pay under the ETS. S&P Global estimates this will lift European cement prices by roughly 5% — enough to shift the economics of clinker substitution, alternative fuels, and CCS investment from optional to necessary.
Outside Europe, carbon pricing is spreading. Canada’s federal carbon pricing system, various US state-level climate policies, and emerging schemes in Asia are all creating cost signals that favor low-carbon cement.
National Decarbonization Targets
Multiple countries have set cement-specific decarbonization targets:
- India aims to reduce the clinker-to-cement ratio to 0.60 by 2030 (from approximately 0.75 today).
- The EU targets a 30% reduction in cement sector emissions by 2030 versus 1990 levels.
- Saudi Arabia’s Vision 2030 includes green building standards that favor low-carbon construction materials.
- China’s dual carbon goals (peak emissions by 2030, carbon neutrality by 2060) are slowly filtering into cement industry policy, though enforcement remains uneven.
These targets aren’t aspirational — they’re translating into building codes, procurement mandates, and tax incentives that create real market demand for low-carbon cement.
Green Procurement Mandates
Buy Clean laws in the US (California, New York, Colorado, Oregon, and others) require state-funded construction projects to consider the embodied carbon of building materials, including cement. The US federal government has followed with Buy Clean provisions in the Inflation Reduction Act.
In Europe, Level(s) — the EU’s framework for sustainable buildings — is creating a common methodology for assessing and reporting the lifecycle environmental performance of buildings, including the carbon footprint of the cement used.
For procurement managers, these mandates are creating both opportunity and complexity. Opportunity, because they justify paying a premium for low-carbon options. Complexity, because verifying embodied carbon claims requires reliable data — and that data infrastructure is still being built.
Your Move: What These Shifts Mean for Producers, Investors, and Buyers
Where you sit in the value chain determines what the cement industry trends 2026 mean for you. The imperatives are different for producers, investors, and procurement managers.
For Cement Producers
1. Stop optimizing for global averages. The China divergence means your regional position matters more than your global rank. If you have heavy China exposure, your strategy must be about efficiency and consolidation — not growth. If you’re ex-China, growth is available, but you need to capture it before competitors with freed-up capital arrive.
2. Treat decarbonization as a revenue stream, not a cost center. The green cement market is growing at 11.9% CAGR. evoZero® is a branded product, not a compliance exercise. Every percentage point of clinker substitution you achieve lowers both your carbon bill and your fuel cost. Every tonne of captured CO₂ that you can verify and sell as a premium product creates margin that conventional cement cannot match.
3. Invest in digital infrastructure before decarbonization infrastructure. The data is clear: intelligent plants (85–91% OEE) generate the operational surplus needed to fund CCS, alternative fuel systems, and SCM sourcing. Reactive plants (62–68% OEE) are too margin-constrained to afford the transition. Digital maturity is the gateway to decarbonization economics.
For Investors
1. Follow the SCM supply chain. CRH’s $2.1B bet on Eco Material Technologies signals that the bottleneck in cement decarbonization isn’t demand for low-carbon cement — it’s supply of the materials needed to produce it. Companies that control SCMs, calcined clay production, and alternative fuel processing have a structural advantage.
2. Favor regional density over global diversification. The Holcim-Amrize spin-off model — creating focused regional champions rather than sprawling multinationals — is proving more value-creative. Markets have different carbon costs, demand trajectories, and competitive dynamics. Regional focus enables better capital allocation.
3. Watch the digital maturity gap as a leading indicator. The 23+ percentage point OEE gap between reactive and intelligent plants will show up in financial statements within 2–3 years as margin divergence. Companies investing in digital infrastructure now are building the cost advantage that will fund their decarbonization later.
For Procurement Managers
1. Start specifying for embodied carbon now. Buy Clean laws and ESG reporting requirements are making low-carbon cement procurement not just preferable but mandatory for many projects. Building relationships with low-carbon suppliers today avoids scrambling for limited supply tomorrow.
2. Understand the green cement premium structure. Low-carbon cement costs more — but the premium varies widely depending on the technology (clinker substitution vs. CCS vs. alternative fuels) and the verification infrastructure behind the claims. Ask for Environmental Product Declarations (EPDs) and third-party verification.
3. Factor total cost of ownership, not just unit cost. A cement with lower embodied carbon may cost 5–15% more per tonne but could save 20–30% in project-level carbon compliance costs, tax incentives, and green certification premiums.
Conclusion: Cement Industry Trends 2026 — The Inflection Point
Enough talk. The numbers are here, and they don’t negotiate.
Three structural shifts define this inflection point in the cement industry trends 2026. China’s divergence means global aggregates are meaningless — strategy must be regional. Decarbonization’s commercialization — led by Brevik CCS, evoZero®, and the $3.29 billion green cement market — means low-carbon cement is no longer a research curiosity; it’s a competitive product with real customers and real margins. Digital transformation has split the industry into performance tiers so far apart that they may as well be in different industries — and only the top tier can afford the transition costs of decarbonization.
The capital flows confirm the direction: 2.1billionforSCMsupplychains,278 million for alternative fuel infrastructure, billions more for CCS deployment. These cement industry trends 2026 confirm that capital is following carbon — not capacity.
For producers, the imperative is clear: invest in digital foundations, accelerate clinker substitution, and position low-carbon cement as a branded premium product. For investors, the opportunity is in the enabling infrastructure — SCMs, alternative fuels, and digital platforms — that makes the transition possible. For procurement managers, the time to build low-carbon supply relationships is now, before demand outstrips the still-limited supply.
The cement industry trends 2026 show that “hard to abate” no longer means “impossible to profit from.” The producers, investors, and buyers who recognize that distinction first will have a meaningful head start.
Start exploring our cement industry data platform → — Access regional demand forecasts, carbon pricing scenarios, and digital maturity benchmarks in one integrated toolkit.
Frequently Asked Questions
What are the key cement industry trends in 2026?
The three key cement industry trends 2026 are: 1) Decarbonization moving from pilot projects to commercial reality, highlighted by Heidelberg Materials’ Brevik CCS plant and the evoZero® brand; 2) Digital transformation creating a performance gap between intelligent plants (85–91% OEE) and reactive plants (62–68% OEE); and 3) Capital reallocation from new kiln capacity to decarbonization supply chains, exemplified by CRH’s $2.1B acquisition of Eco Material Technologies.
How big is the green cement market in 2026?
The green cement market growth 2026 shows the market reaching an estimated 2.94billionin2025andprojectedtohit3.29 billion in 2026, growing at a CAGR of 11.9% — nearly four times the growth rate of the overall cement market (Research and Markets).
Why is China’s cement demand declining in 2026?
China’s cement output dropped roughly 10% in 2024 and the contraction continues due to property sector deleveraging (post-Evergrande), plateauing urbanization rates, declining population, and the end of double-digit infrastructure spending. This structural shift is not cyclical — it’s a permanent restructuring.
What is the cement market size in 2026?
The global cement industry forecast places the market at 411–436billionin2026,upfrom384–426 billion in 2025, depending on the source (Fortune Business Insights; Mordor Intelligence). Global production reached approximately 4.37 billion tonnes in 2025, with projections toward 5.51 billion tonnes by 2031.
How does CBAM affect the cement industry in 2026?
CBAM (Carbon Border Adjustment Mechanism) is the EU’s border carbon tax that imposes carbon costs on imported cement and clinker equivalent to what EU producers pay under the ETS. S&P Global estimates CBAM will lift European cement prices by approximately 5%, shifting the economics of clinker substitution, alternative fuels, and CCS investment from optional to necessary.